
We know that there are over 10 countries offering citizenship by investment and over 20 countries offering golden visa residency schemes for wealthy families and investors. The Growth of Golden visa /CBI industry is nearing 15 billion in 2018 and expected to more with more and more countries offering investor visas for investors
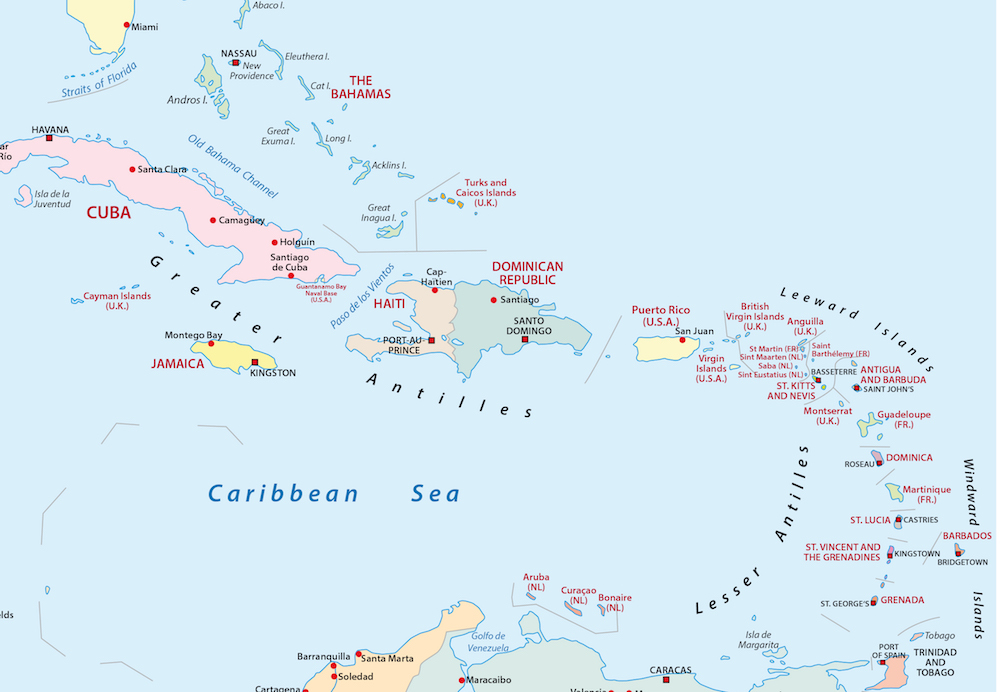
Clients may have a difficulty locating CBI countries on a map. But what is known about these countries in terms of economy, debt, population, healthcare education, safety? Is the economy stable and investment will be safe?
These are vital indicators we have compiled, clients need to check before investing in these countries for citizenship or residency.
There are several interesting information available from the economic indicators among countries offering Golden visa or citizenship schemes…
- St Kitts population is only 55,000 while Moldova has 3.5M population
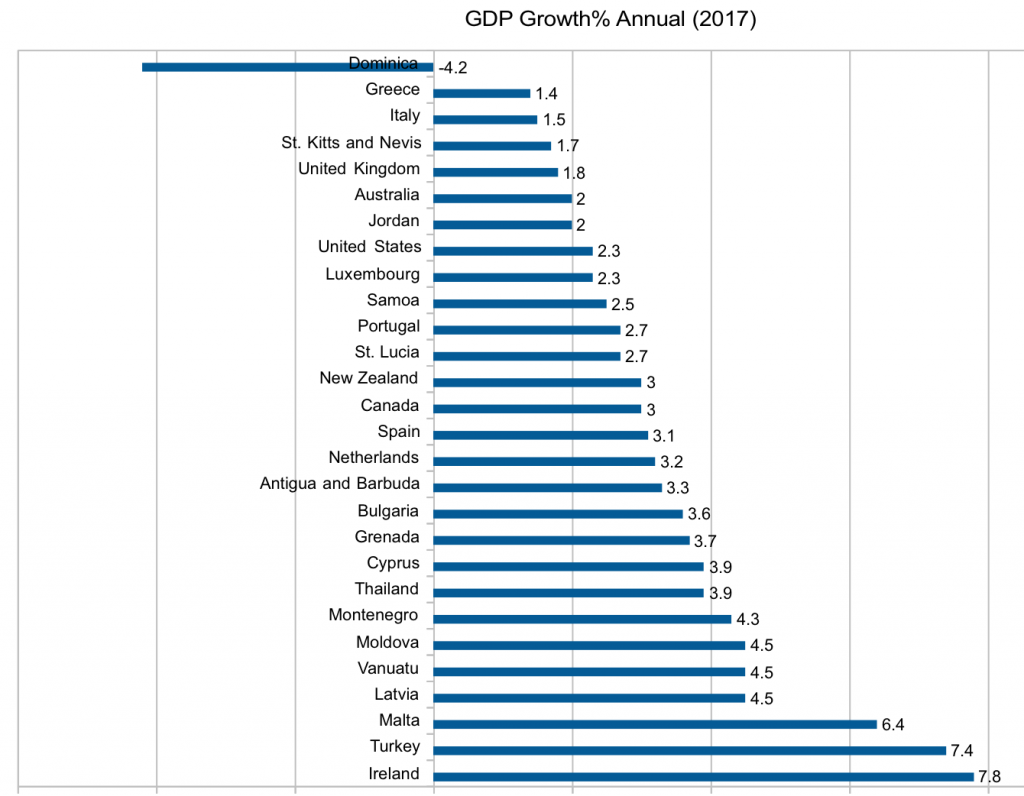
- Ireland and Malta had the highest GDP growth in 2017. Vanuatu also surprisingly 4.5% GDP growth.
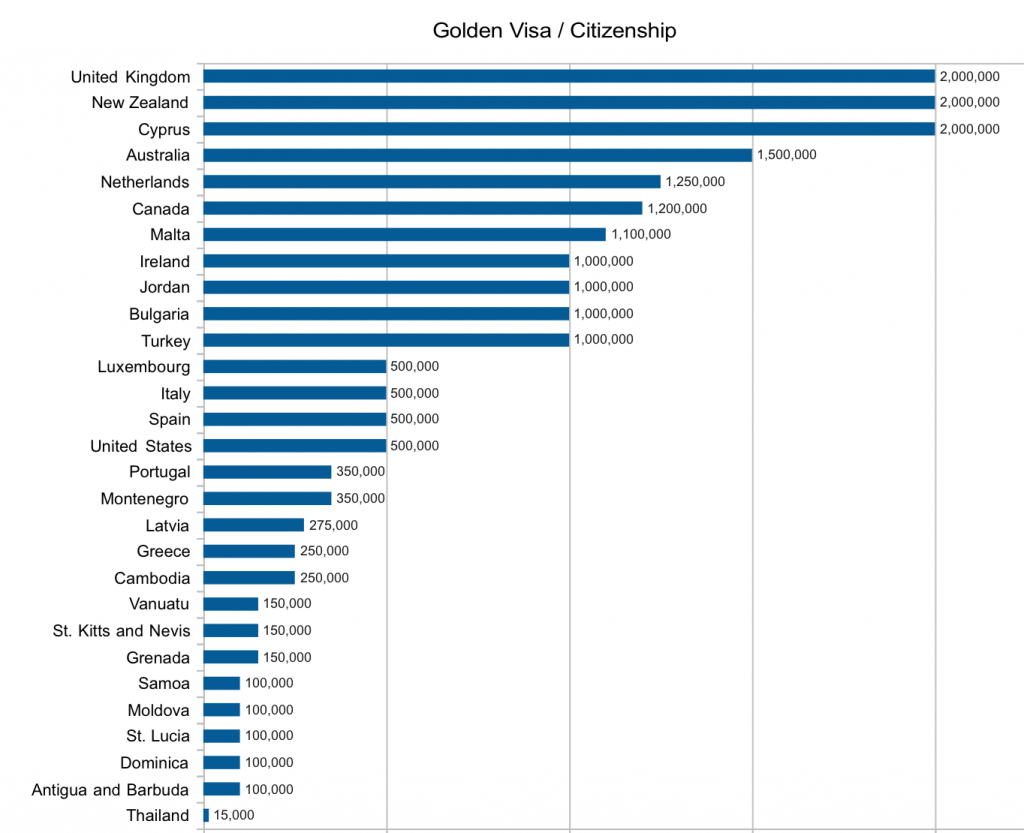
- New Zealand is the most preferred country for UHNW population, competes with United Kingdom, Cyprus with 2 million investment
- Thailand is the cheapest residency program in the world offering residence visa for just $15,000
- Maria was Dominica’s worst natural disaster with damage estimated at US$1.3 billion (226 percent of GDP) and because of this disaster, Dominica GDP growth is in negative. IMF said it will take 5 years to recover at pre-hurricane levels.
- FDI inflows in St Lucia is higher than St Kitts and Grenada.
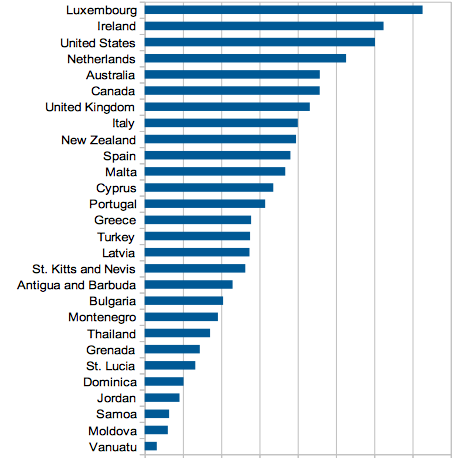
- Luxembourg and Ireland are the richest countries in terms of GDP per capita.
- Inflation is very high in Moldova.
- New Zealand ranks first in doing business, registering a property above any other country in the world.
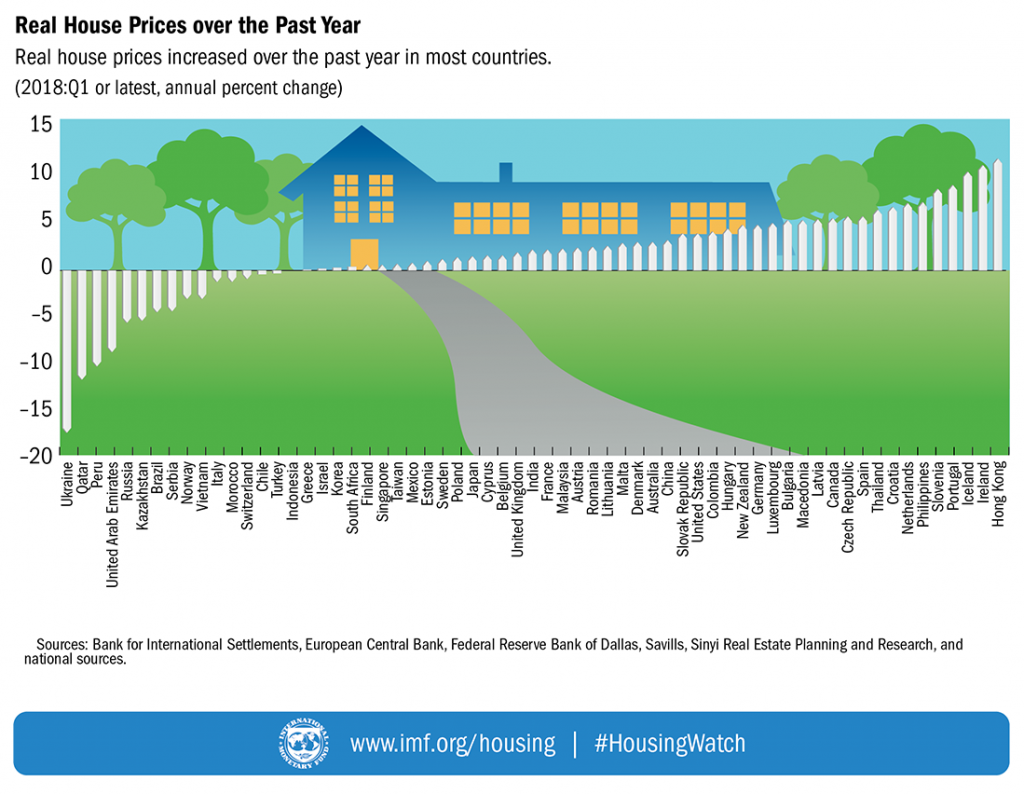
- House prices have jumped by 11% in Ireland and 8.9% in Portugal.
- US, Spain and Italy are the top 3 nations with highest tourist arrivals. Saint Lucia has highest tourist arrivals than all the other caribbean CBI countries.
- Australia and New Zealand have the highest Human development index (HDI)
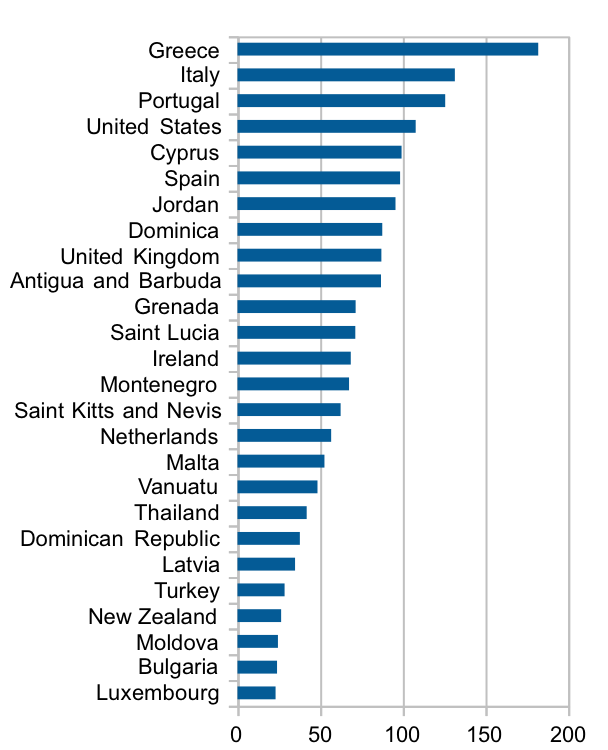
- Greece, Italy and Portugal still have has the high government debt above 100%
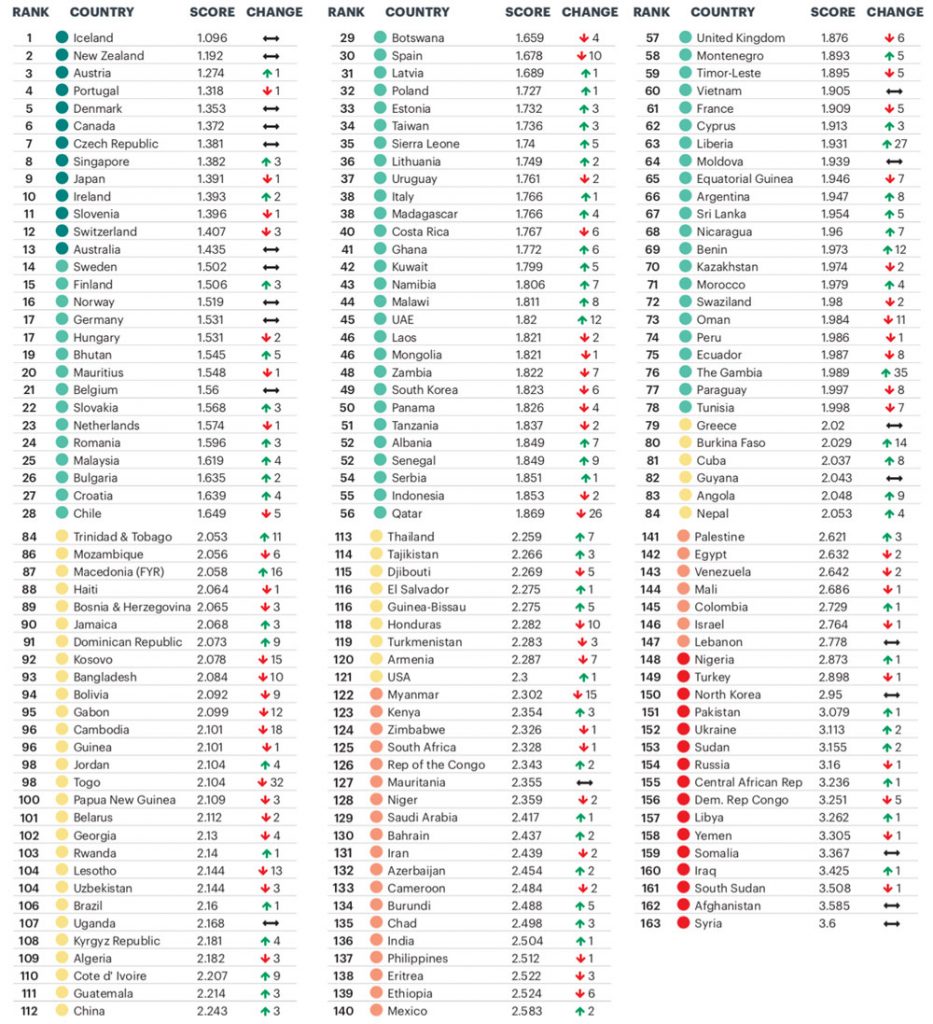
- New Zealand, Portugal and Canada are the safest peaceful countries in the world.
- Italy passport is the best passport among Golden visa /CBI programs
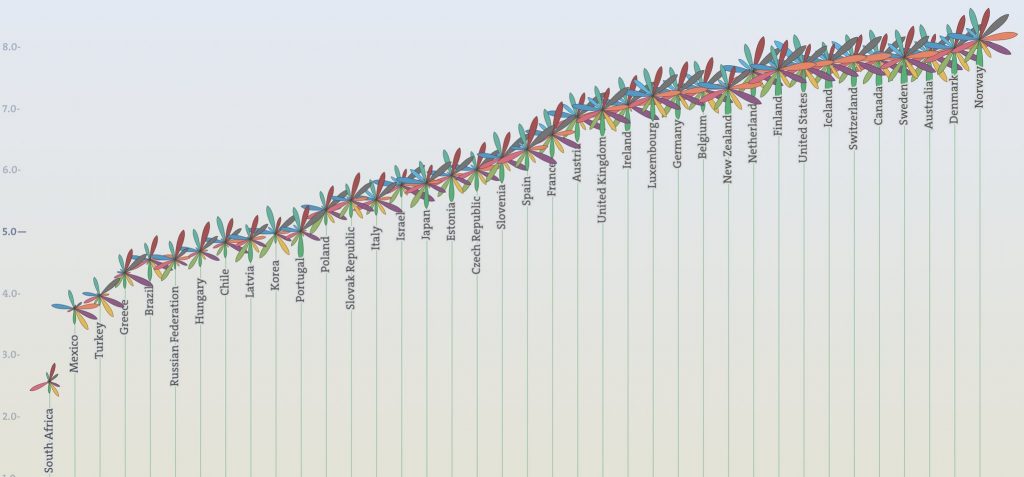
- Australia and Canada are best countries in OECD better life index.
- US imposes taxes on worldwide income and highest personal income taxes are in Canada, Luxembourg, United States, Ireland. Bulgaria, Cyprus and Ireland have the lowest corporate tax rates.
Investment for citizenship/residency
| Minimum Investment | You get | |
| United States | $500,000 | Residency |
| Canada | $1,200,000 | Residency |
| Australia | $1,500,000 | Residency |
| United Kingdom | £2,000,000 | Residency |
| Antigua and Barbuda | $100,000 | Citizenship |
| Dominica | $100,000 | Citizenship |
| Grenada | $150,000 | Citizenship |
| St. Lucia | $100,000 | Citizenship |
| Malta | €1,100,000 | Citizenship |
| Cyprus | €2,000,000 | Citizenship |
| St. Kitts and Nevis | $150,000 | Citizenship |
| Moldova | €100,000 | Citizenship |
| Montenegro | €350,000 | Citizenship |
| Vanuatu | $150,000 | Citizenship |
| Samoa | $1,000,000 | Citizenship |
| Turkey | $1,000,000 | Citizenship |
| Bulgaria | $1,000,000 | Citizenship |
| Jordan | $1,000,000 | Residency |
| Cambodia | $250,000 | Citizenship |
| Portugal | $350,000 | Residency |
| Greece | €250,000 | Residency |
| Malta (GV) | €250,000 | Residency |
| Spain | €500,000 | Residency |
| Italy | €500,000 | Residency |
| Netherlands | €1,250,000 | Residency |
| Latvia | €275,000 | Residency |
| Luxembourg | €500,000 | Residency |
| New Zealand | $2,000,000 | Residency |
| Ireland | €1,000,000 | Residency |
| Thailand | $15,000 | Residency |
GDP (annual growth) 2017
Annual growth of GDP% in 2017
|
Total Population
|
Population Growth
|
Richest countries (GDP per capita)
|
Foreign direct investment net inflows (BoP, current US$)
| FDI inflows | 2016 |
| United States | 479,415,000,000 |
| United Kingdom | 265,810,566,655 |
| Netherlands | 185,753,131,800 |
| Ireland | 79,163,353,503 |
| Australia | 42,579,991,135 |
| Canada | 34,612,041,093 |
| Spain | 32,116,526,541 |
| Luxembourg | 26,857,367,248 |
| Italy | 19,635,898,220 |
| Turkey | 13,343,000,000 |
| Portugal | 9,422,380,926 |
| Thailand | 3,063,235,324 |
| Greece | 3,060,785,237 |
| Cyprus | 2,607,132,723 |
| Malta | 2,479,130,072 |
| Cambodia | 2,287,033,631 |
| New Zealand | 1,934,890,721 |
| Bulgaria | 1,655,550,000 |
| Latvia | 243,503,899 |
| Montenegro | 226,666,592 |
| St. Lucia | 95,992,565 |
| Grenada | 91,261,715 |
| Moldova | 90,970,000 |
| St. Kitts and Nevis | 84,477,920 |
| Antigua and Barbuda | 48,937,180 |
| Dominica | 31,614,189 |
| Samoa | 2,524,382 |
Inflation (Annual%)
|
Doing Business
| Economy | Ease of Doing Business Rank | Starting a Business | Dealing with Construction Permits | Registering Property | Getting Credit | Protecting Minority Investors | Paying Taxes |
| New Zealand | 1 | 1 | 3 | 1 | 1 | 2 | 9 |
| Singapore | 2 | 6 | 16 | 19 | 29 | 4 | 7 |
| Hong Kong SAR, China | 5 | 3 | 5 | 55 | 29 | 9 | 3 |
| United States | 6 | 49 | 36 | 37 | 2 | 42 | 36 |
| United Kingdom | 7 | 14 | 14 | 47 | 29 | 10 | 23 |
| Australia | 14 | 7 | 6 | 51 | 6 | 57 | 26 |
| Ireland | 17 | 8 | 30 | 40 | 42 | 10 | 4 |
| Canada | 18 | 2 | 54 | 33 | 12 | 8 | 16 |
| Latvia | 19 | 21 | 49 | 22 | 12 | 43 | 13 |
| Thailand | 26 | 36 | 43 | 68 | 42 | 16 | 67 |
| Spain | 28 | 86 | 123 | 53 | 68 | 24 | 34 |
| Portugal | 29 | 48 | 32 | 28 | 105 | 57 | 38 |
| Netherlands | 32 | 20 | 76 | 30 | 105 | 62 | 20 |
| Montenegro | 42 | 60 | 78 | 76 | 12 | 51 | 70 |
| Moldova | 44 | 23 | 165 | 20 | 42 | 33 | 32 |
| Italy | 46 | 66 | 96 | 23 | 105 | 62 | 112 |
| Bulgaria | 50 | 95 | 51 | 67 | 42 | 24 | 90 |
| Cyprus | 53 | 50 | 120 | 92 | 68 | 43 | 44 |
| Turkey | 60 | 80 | 96 | 46 | 77 | 20 | 88 |
| Luxembourg | 63 | 70 | 7 | 88 | 173 | 119 | 21 |
| Greece | 67 | 37 | 58 | 145 | 90 | 43 | 65 |
| Malta | 84 | 102 | 45 | 147 | 142 | 51 | 71 |
| Vanuatu | 90 | 128 | 151 | 80 | 29 | 108 | 57 |
| St. Lucia | 91 | 69 | 34 | 105 | 159 | 96 | 74 |
| Dominica | 98 | 67 | 74 | 164 | 142 | 96 | 77 |
| Dominican Republic | 99 | 116 | 62 | 79 | 105 | 96 | 149 |
| Jordan | 103 | 105 | 110 | 72 | 159 | 146 | 97 |
| Antigua and Barbuda | 107 | 126 | 99 | 118 | 159 | 96 | 144 |
| St. Kitts and Nevis | 134 | 91 | 33 | 184 | 159 | 119 | 124 |
Human Development Index (HDI)
| HDI Rank (2015) | Country | HDI Index |
| 2 | Australia | 0.939 |
| 7 | Netherlands | 0.924 |
| 8 | Ireland | 0.923 |
| 10 | Canada | 0.92 |
| 10 | United States | 0.92 |
| 13 | New Zealand | 0.915 |
| 16 | United Kingdom | 0.91 |
| 20 | Luxembourg | 0.898 |
| 26 | Italy | 0.887 |
| 27 | Spain | 0.884 |
| 29 | Greece | 0.866 |
| 33 | Cyprus | 0.856 |
| 33 | Malta | 0.856 |
| 41 | Portugal | 0.843 |
| 44 | Latvia | 0.83 |
| 48 | Montenegro | 0.807 |
| 56 | Bulgaria | 0.794 |
| 62 | Antigua and Barbuda | 0.786 |
| 71 | Turkey | 0.767 |
| 74 | Saint Kitts and Nevis | 0.765 |
| 79 | Grenada | 0.754 |
| 86 | Jordan | 0.742 |
| 87 | Thailand | 0.74 |
| 92 | Saint Lucia | 0.735 |
| 96 | Dominica | 0.726 |
| 104 | Samoa | 0.704 |
| 134 | Vanuatu | 0.597 |
Tourist Arrivals
|
Government Debt
House prices Growth
The grwoth of real estate house prices, annual percent change in Q1 1018. Ireland, Portugal, Netherlands, Thailand and Spain are the countries offering investor visas against property investment
| Period | Country | Growth |
| 2017q4 | Hong Kong | 11.80919 |
| 2017q4 | Ireland | 11.12492 |
| 2018q1 | Iceland | 10.40808 |
| 2017q4 | Portugal | 8.952976 |
| 2017q4 | Slovenia | 8.56352 |
| 2017q4 | Philippines | 7.178433 |
| 2017q4 | Netherlands | 7.052071 |
| 2018q1 | Croatia | 6.741706 |
| 2018q1 | Thailand | 6.375929 |
| 2017q4 | Spain | 5.723985 |
| 2017q4 | Czech Republic | 5.680169 |
| 2018q1 | Canada | 5.534327 |
| 2017q4 | Latvia | 5.446397 |
| 2018q1 | Macedonia | 5.306688 |
| 2017q4 | Bulgaria | 5.251329 |
| 2018q1 | Luxembourg | 5.022594 |
| 2017q4 | Germany | 4.811527 |
| 2017q4 | New Zealand | 4.786305 |
| 2017q4 | Hungary | 4.448677 |
| 2017q4 | Colombia | 4.078878 |
| 2017q4 | United States | 3.949528 |
| 2017q4 | Slovak Republic | 3.942965 |
| 2017q4 | China | 3.183242 |
| 2017q4 | Australia | 3.028827 |
| 2017q4 | Denmark | 3.008338 |
| 2017q3 | Malta | 2.922236 |
| 2017q4 | Lithuania | 2.573503 |
| 2017q4 | Romania | 2.522114 |
| 2017q4 | Austria | 2.408649 |
| 2017q4 | Malaysia | 2.311287 |
| 2017q4 | France | 2.191336 |
| 2018q1 | India | 2.168578 |
| 2017q4 | United Kingdom | 1.943424 |
| 2017q4 | Belgium | 1.625334 |
| 2017q4 | Cyprus | 1.554852 |
| 2017q4 | Japan | 1.469038 |
| 2017q4 | Poland | 1.434907 |
| 2017q4 | Sweden | 1.161204 |
| 2017q4 | Estonia | 0.9624728 |
| 2017q4 | Mexico | 0.7624792 |
| 2017q1 | Taiwan | 0.6951112 |
| 2017q4 | Singapore | 0.6174846 |
| 2017q4 | Finland | 0.6007892 |
| 2017q4 | South Africa | 0.369209 |
| 2018q1 | Korea | 0.3457799 |
| 2018q1 | Israel | 0.1750932 |
| 2018q1 | Greece | 0.0852117 |
| 2017q4 | Indonesia | 0.0113623 |
| 2018q1 | Turkey | -0.2949864 |
| 2017q2 | Chile | -0.3548891 |
| 2018q1 | Switzerland | -0.8647816 |
| 2017q4 | Morocco | -1.217294 |
| 2017q4 | Italy | -1.23174 |
| 2017q2 | Vietnam | -2.951717 |
| 2018q1 | Norway | -3.031672 |
| 2017q4 | Serbia | -4.341939 |
| 2017q4 | Brazil | -4.426491 |
| 2017q4 | Kazakhstan | -5.311509 |
| 2017q4 | Russia | -5.456003 |
| 2018q1 | United Arab Emirates | -8.551841 |
| 2017q4 | Peru | -10.14404 |
| 2018q1 | Qatar | -11.54784 |
| 2018q1 | Ukraine | -17.13225 |
Safest countries
Safest countries in the world according to Global peace index 2018. New Zealand, Portugal, Canada are the top countries
Passport rank
Passport power with visa free travel freedom is one of the important indicators of Golden visa/ CBI programs.
| Henley Passport Index 2018 | Rank | Visa free countries |
| Greece | 6 | 183 |
| Italy | 3 | 187 |
| Portugal | 4 | 186 |
| United States | 4 | 186 |
| Canada | 5 | 185 |
| Cyprus | 14 | 171 |
| Spain | 3 | 187 |
| Jordan | 87 | 50 |
| Dominica | 34 | 136 |
| United Kingdom | 4 | 186 |
| Australia | 6 | 183 |
| Antigua and Barbuda | 25 | 149 |
| Grenada | 31 | 141 |
| Saint Lucia | 30 | 142 |
| Ireland | 5 | 185 |
| Montenegro | 42 | 123 |
| Saint Kitts and Nevis | 24 | 151 |
| Netherlands | 4 | 186 |
| Malta | 7 | 182 |
| Vanuatu | 37 | 129 |
| Thailand | 66 | 76 |
| Latvia | 10 | 179 |
| Turkey | 49 | 111 |
| New Zealand | 7 | 182 |
| Moldova | 44 | 121 |
| Bulgaria | 16 | 169 |
| Luxembourg | 4 | 186 |
Tax rates by countries
Taxes must not be overlooked by UHNWs when applying for golden visa investment.
| Country | Corporate tax | Income tax
(minimum ) |
Income tax
(maximum ) |
|---|---|---|---|
| 28.5%–30% | 0% | 47% | |
| 10% (+5% on distribution of profit) | 10% | 10% + 18% social security fund tax | |
| 13%[44] | 19% (15% federal tax + 4%–11% provincial tax)[45][46] | 58.75% in Quebec(33% federal tax + 25.75% provincial and local tax)[47][48] | |
| 12.5% | 0% | 35% | |
| N/A | N/A | N/A | |
| 29% (+29% paid in advance & returned after 1 year) | 22% (€1,900 tax deducted if income <€21,000) |
45% | |
| N/A | N/A | N/A | |
| 12.5% | 20% (first €1,650 per year is deductible) | 52% (40% Income Tax + 12% social insurance contributions on income above €70,000, 9% social security contributions between €18,000 and €70,000) | |
| 20% | 0% | 14% | |
| 0% / 20% (flat tax rate) [96] | 23% (flat tax rate) | 23% | |
| 29.22% | 6% | 52.45% total: 40%[104] + 12.45% social security charges[105] | |
| 0–10% (35%[32]pre rebate) | 0% | 35% | |
| 12% | 7% | 18% | |
| 9%[118][119] | 9% (first EUR 720) | 15% | |
| 20% on first €250,000 profit.25% on €250,001+ profit | 36.55% (first €21.103 per year is deductible) | 51.95% [125] + reduction of deductions (arbeidskorting and general korting) | |
| 28% | 10.5%[126] | 33%[127] | |
| 21% | 14.5% | 48% | |
| 0 % | 0 % | 0 % | |
| N/A | N/A | N/A | |
| 25% | 0% (below €12,000) | 45% | |
| 20% | 0% | 35% | |
| 20% | 15% | 35% | |
| 19% | 20% £11,851 to £46,350, 0% under 11,850 and 40% £46351 to £150,000 [162] | 45% [163] (on income over £150,000) | |
| 21% + 0–12% State/Local[32] | 0% (federal) + 0% (state) + 0%–3% (local) |
51.8% =37% (max federal[165]) +
13.3% (max state[166]) + 1.5% (city) |
|
| N/A | N/A | N/A |
The following table summarizes the taxation of local and foreign income of individuals, depending on their residence or citizenship in the country.
| Country or territory | Taxes local income of |
Taxes foreign income of |
||||
|---|---|---|---|---|---|---|
|
nonresident
individuals |
resident
citizens |
resident
foreigners |
resident
citizens |
resident
foreigners |
nonresident
citizens |
|
| no | no | no | no | no | no | |
| no | no | no | no | no | no | |
| no | no | no | no | no | no | |
| no | no | no | no | no | no | |
| no | no | no | no | no | no | |
| no | no | no | no | no | no | |
| no | no | no | no | no | no | |
| no | no | no | no | no | no | |
| no | no | no | no | no | no | |
| no | no | no | no | no | no | |
| no | no | no | no | no | no | |
| no | no | no | no | no | no | |
| no | no | no | no | no | no | |
| no | no | no | no | no | no | |
| no | no | no | no | no | no | |
| no | no | no | no | no | no | |
| no | no | no | no | no | no | |
| no | no | no | no | no | no | |
| no | no | no | no | no | no | |
| no | no | no | no | no | no | |
| no | no | no | no | no | no | |
Best Golden visa schemes for UHNW population
1. New Zealand $2m
2. United Kingdom £2m
3. Australia $1.5m 4. United States $500K
5. Canada $1.2m
7. *Malta $1.1m
8. *Cyprus €2m
9. Ireland €1m
10. Spain €500K
* Citizenship by investment
Top 10 countries in OECD better life index
1. Norway
2. Denmark
3. Australia
4. Sweden
5. Canada
6. Switzerland
7. Iceland
8. United States
9. Finland
10. Netherlands
11. New Zealand
Net migration 2017
Migration, is a significant part of global integration. Migrants contribute to the economies of both their host country and their country of origin.
Net migration = Immigrants – Emigrants
- United States 4.5M
- Germany 1,8M
- Canada1,1M
- United Kingdom 900K
- Australia 849K
- France 400K
- Italy 350K
- Switzerland 250K
- Belgium 240K
- Spain 200K
- Sweden200K
- Netherlands 80K
- Denmark 75K
- Finland 70K
- Estonia -5K
- Portugal -30K
- Latvia -50K
Source: World bank data
Past Economic Citizenship by Investment Programs
- Scotland 18th century – £83
- St Kitts 1984 – $150K
- Dominica 1993 $50K
- Belize 1985-2001 $40K
- Ireland 1984-1994 £1m
- Grenada 1997-2001 $50K
- Montenegro 2008-2010 €500K
- Nauru 1998-2002 $50K
- Tonga 1982-96 $50K
- Vanuatu 1996-97 $50K
Citizenship Time
Processing time for citizenship (immediate or later) based on golden visa / CBI
| Country | Processing Time | Minimum Stay Requirements | Permanent Residency (PR) | Naturalisation Time for Citizenship | Dual Citizenship |
| Australia | 4 months | 40 days per year | After 4 years | PR + 4 years | yes |
| Antigua & Barbuda | 3 months | 5 days | immediate | immediate | yes |
| Bulgaria | 2 months | – | Immediate | After 5 years | yes |
| Canada (Quebec) | 8-10 months | yes | 3 years | 5 years in total | yes |
| Cyprus | 7 months | 6-7 months | immediate | immediate | yes |
| Dominica | 4 months | none | immediate | immediate | yes |
| Grenada | 3 months | none | immediate | immediate | yes |
| Greece | 3-4 months | – | Immediate PR granted | 7 years | yes |
| Moldova | 3 months | – | immediate | immediate | yes |
| Montenegro | 3 months | – | immediate | immediate | yes |
| Ireland | 3 months | – | 5 years | 5 years | yes |
| Italy | 2 months | – | 5 years | 10 years | yes |
| Malta | 3 months | 12-14 months | immediate | immediate | yes |
| Netherlands | 3 months | yes | 5 years | 5 years | no |
| Portugal | 3-4 months | 7 days per year | After 5 years | 6 years | yes |
| Spain | 3 months | none | After 5 years | 10 years | only with spanish speaking countries |
| St Lucia | 2-3 months | none | immediate | immediate | yes |
| St Kitts and Nevis | 3 months | none | immediate | immediate | yes |
| United Kingdom | 2 months | 9 months per year for UK passport | 5 years | 6 years | yes |
| United States | 20 months | 50% of time in US (2.5 out of 5 yrs) | Immediate | 5 years | yes |
| Latvia | 4 months | 2 weeks | immediate | 10 years | yes |
| Luxembourg | 2 months | 5 years | 7 years | yes | |
| New Zealand | 3-4 months | 146 days per year | 2 years | 5 years | yes |
| Vanuatu | 2 months | none | immediate | immediate | yes |
| Thailand | 1 month | 5 years | no | ||
| Turkey | 2 months | 5 years | yes |
Sources: World bank, OECD, IMF


